Python Data Analyst Bootcamp: Process, Analyze & Visualize

Python Data Analyst Bootcamp: Process, Analyze & Visualize
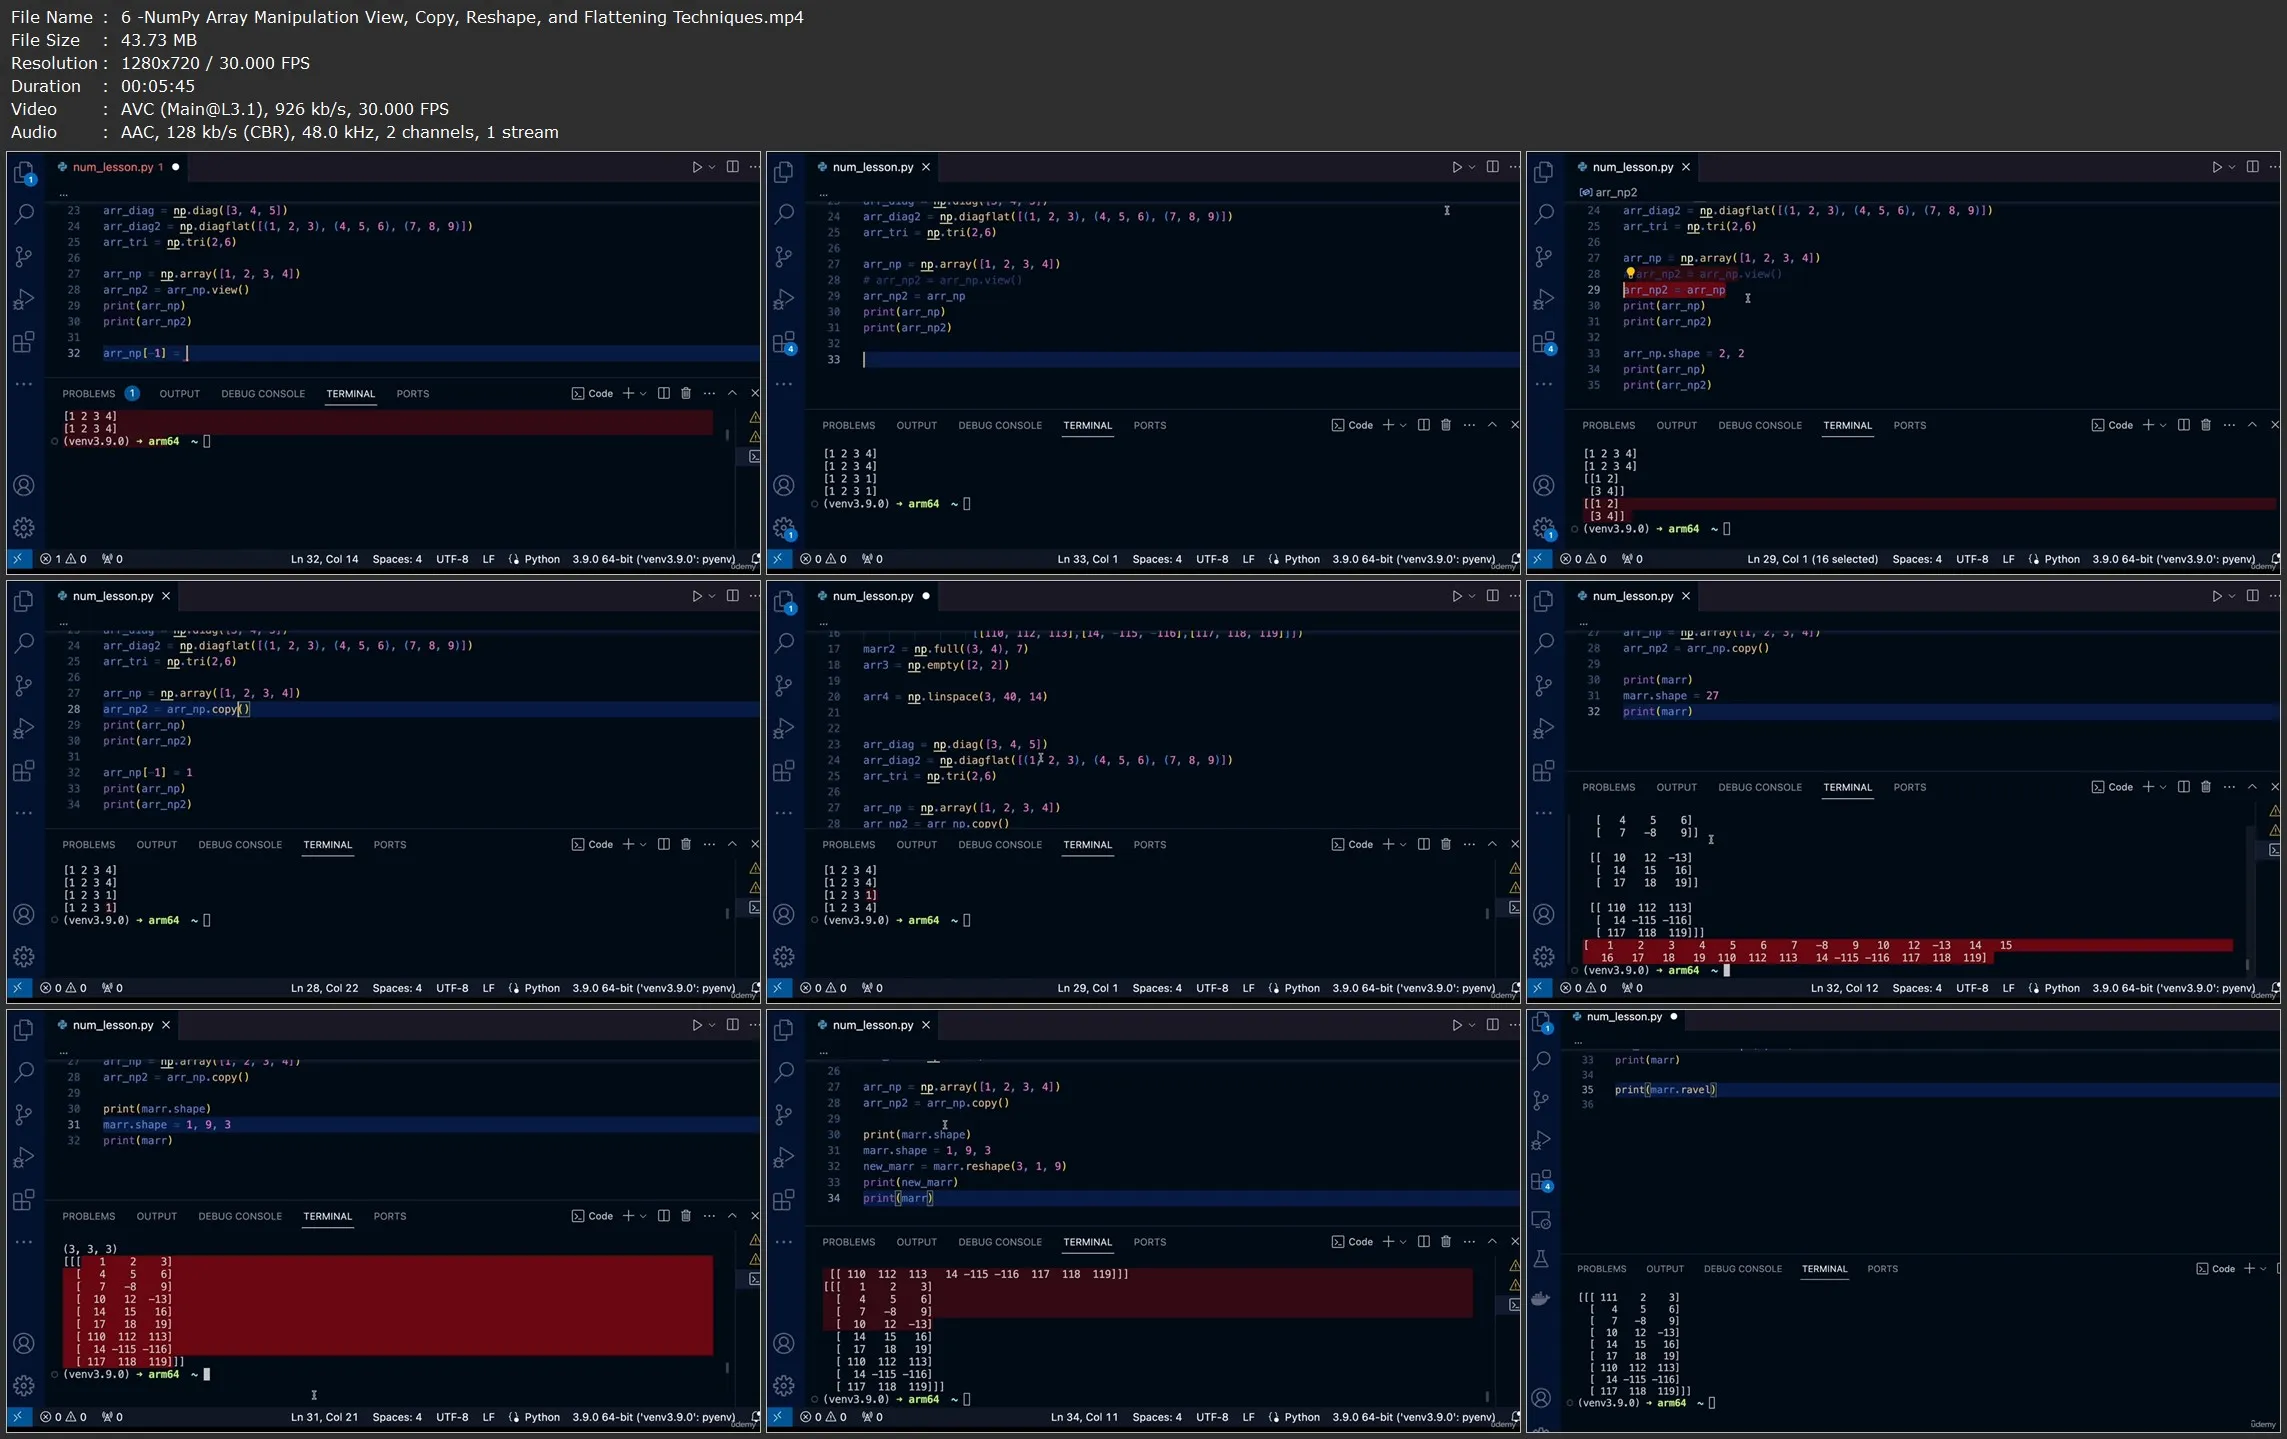
.MP4, AVC, 1280x720, 30 fps | English, AAC, 2 Ch | 12h 1m | 5.93 GB
Instructor: Olga Piliaieva
.MP4, AVC, 1280x720, 30 fps | English, AAC, 2 Ch | 12h 1m | 5.93 GB
Instructor: Olga Piliaieva
The most in-demand Python libraries for data analysis, visualization & dashboards with practice and a portfolio project
What you'll learn
- Learn Python from scratch, and use NumPy & Pandas for data manipulation. Work with real datasets and develop essential data analysis skills.
- Master Seaborn, Matplotlib, and Polars for data visualization and processing. Work with real stock price data from yfinance to create insightful visualizations.
- Gain Git skills for version control and collaboration. Manage projects efficiently and work seamlessly in teams.
- Create interactive dashboards with Streamlit, visualize stock price data, and deploy your project for free on Streamlit Cloud. Create your portfolio
Requirements
- No prior experience required! This course is beginner-friendly and designed to help you learn Python and data analysis from scratch.
- Basic understanding of programming concepts (variables, loops, conditionals) is helpful, but not mandatory.
- A computer with an internet connection to access course materials and run code.
- A passion for learning and a desire to build hands-on projects.
- We will be using Python, Jupyter Notebooks, and VSCode. Don’t worry - we’ll show you how to install Python and set up your development environment step-by-step in the course.
Description
This course is designed to teach you the most in-demand Python libraries and tools used by data professionals, making it ideal for aspiring data scientists, analysts, and developers.
What you’ll learn:
- Python Basics to Advanced: Starting from the fundamentals, we'll build a solid foundation in Python, guiding you through key programming concepts and progressing to advanced topics like Object-Oriented Programming (OOP).
- NumPy & Pandas: Master the core libraries for fast and efficient data wrangling, manipulation, and analysis. Learn how to work with large datasets, handle missing values, and perform advanced calculations.
- Polars: Explore Polars, a fast, scalable DataFrame library. We'll compare it with Pandas to show how Polars offers faster performance for data manipulation, especially with large datasets.
- Data Visualization with Seaborn & Matplotlib: Learn how to visualize data like a pro. From creating simple plots to designing beautiful, interactive charts, you’ll understand how to tell compelling stories with data. We’ll cover everything from basic visualizations to advanced techniques like heatmaps, histograms, and scatter plots.
- Git: Master version control with Git. Learn how to track and manage changes in your code, collaborate on projects, and keep your work organized.
- Building Dashboards with Streamlit: Learn how to create interactive dashboards using Streamlit and Matplotlib. You’ll build a live project from scratch using real-world data and deploy it for free, showcasing your work to others.
As part of this course, you’ll complete numerous hands-on assignments to practice and reinforce your learning. By the end, you’ll have a complete, deployable dashboard project that you can demonstrate to potential employers or clients.
Who this course is for:
- Beginners to Python If you're new to programming, this course will teach you Python from scratch, starting with the fundamentals and progressing to more advanced topics like object-oriented programming.
- Aspiring Data Analysts If you're interested in starting a career in data analysis, this course will give you the foundational skills in Python, data manipulation, and visualization that are in high demand by employers.
- Students and Professionals Looking to Transition to Data If you're looking to switch careers and break into the data field, this course will help you develop the technical skills needed to analyze and visualize real-world data effectively.
- Portfolio Builders - Create real projects to showcase in your data portfolio.
- Self-Learners - Follow a structured path to master Python and data analysis.
Python Data Analyst Bootcamp: Process, Analyze & Visualize