Python: Backend Data Visualization with Matplotlib

Python: Backend Data Visualization with Matplotlib
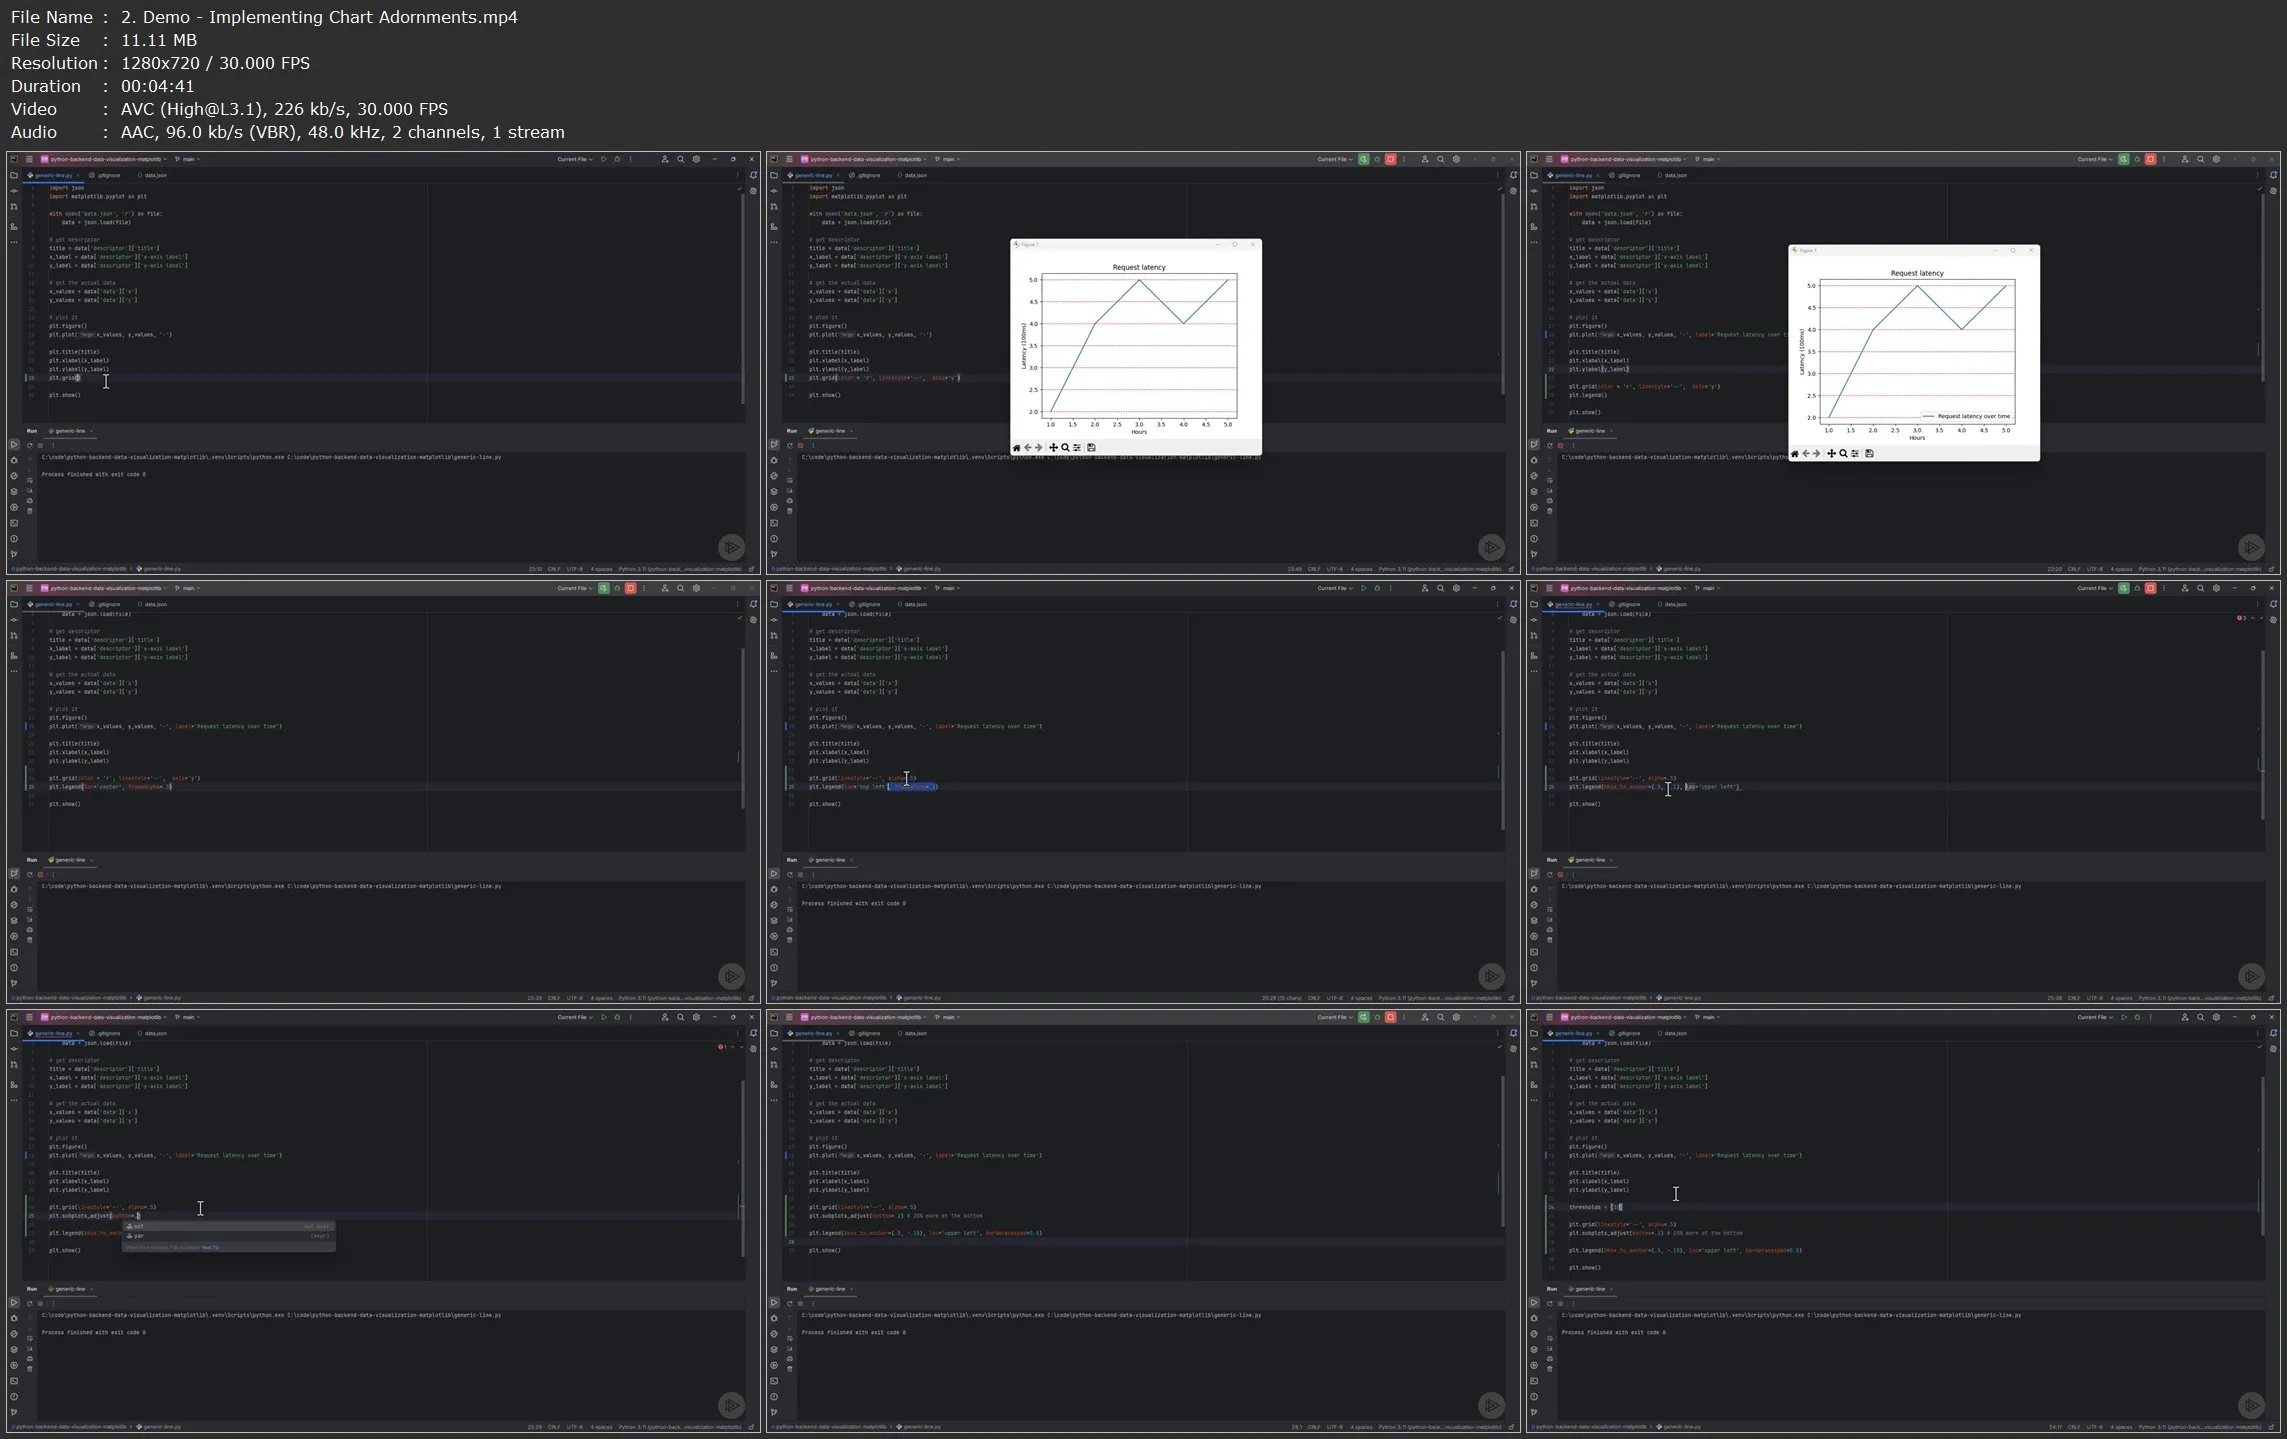
.MP4, AVC, 1280x720, 30 fps | English, AAC, 2 Ch | 51m | 114 MB
Instructor: Chris Behrens
.MP4, AVC, 1280x720, 30 fps | English, AAC, 2 Ch | 51m | 114 MB
Instructor: Chris Behrens
Effective data visualization turns raw data into actionable information. This course will teach you how to use Matplotlib, the premier data visualization tool for Python.
What you'll learn
The world is awash in data, but until data is turned into information, it’s useless. In this course, Python: Backend Data Visualization with Matplotlib, you’ll learn to how to use the most used data visualization tool for Python, Matplotlib. First, you’ll explore the fundamentals of data visualization. Next, you’ll discover how to create effective charts in Python code. Finally, you’ll learn how to integrate your charts with real, live data.
When you’re finished with this course, you’ll have the skills and knowledge of data visualization and data integration needed to transform your raw data into information you can act upon.
Python: Backend Data Visualization with Matplotlib