Statistics with R - Beginner Level

Statistics with R - Beginner Level
Video: .mp4 (1280x720, 30 fps(r)) | Audio: aac, 48000 Hz, 2ch | Size: 2.3 GB
Genre: eLearning Video | Duration: 46 lectures (2 hour, 48 mins) | Language: English
Basic statistical analyses using the R program
Video: .mp4 (1280x720, 30 fps(r)) | Audio: aac, 48000 Hz, 2ch | Size: 2.3 GB
Genre: eLearning Video | Duration: 46 lectures (2 hour, 48 mins) | Language: English
Basic statistical analyses using the R program
What you'll learn
manipulate data in R (filter and sort data sets, recode and compute variables)
compute statistical indicators (mean, median, mode etc.)
determine skewness and kurtosis
get statistical indicators by subgroups of the population
build frequency tables
build cross-tables
create histograms and cumulative frequency charts
build column charts, mean plot charts and scatterplot charts
build boxplot diagrams
check the normality assumption for a data series
detect the outliers in a data series
perform univariate analyses (one-sample t test, binomial test, chi-square test for goodness-of-fit)
Requirements
R and R studio
knowledge of basic statistics
Description
If you want to learn how to perform the basic statistical analyses in the R program, you have come to the right place.
Now you don’t have to scour the web endlessly in order to find how to compute the statistical indicators in R, how to build a cross-table, how to build a scatterplot chart or how to compute a simple statistical test like the one-sample t test. Everything is here, in this course, explained visually, step by step.
So, what will you learn in this course?
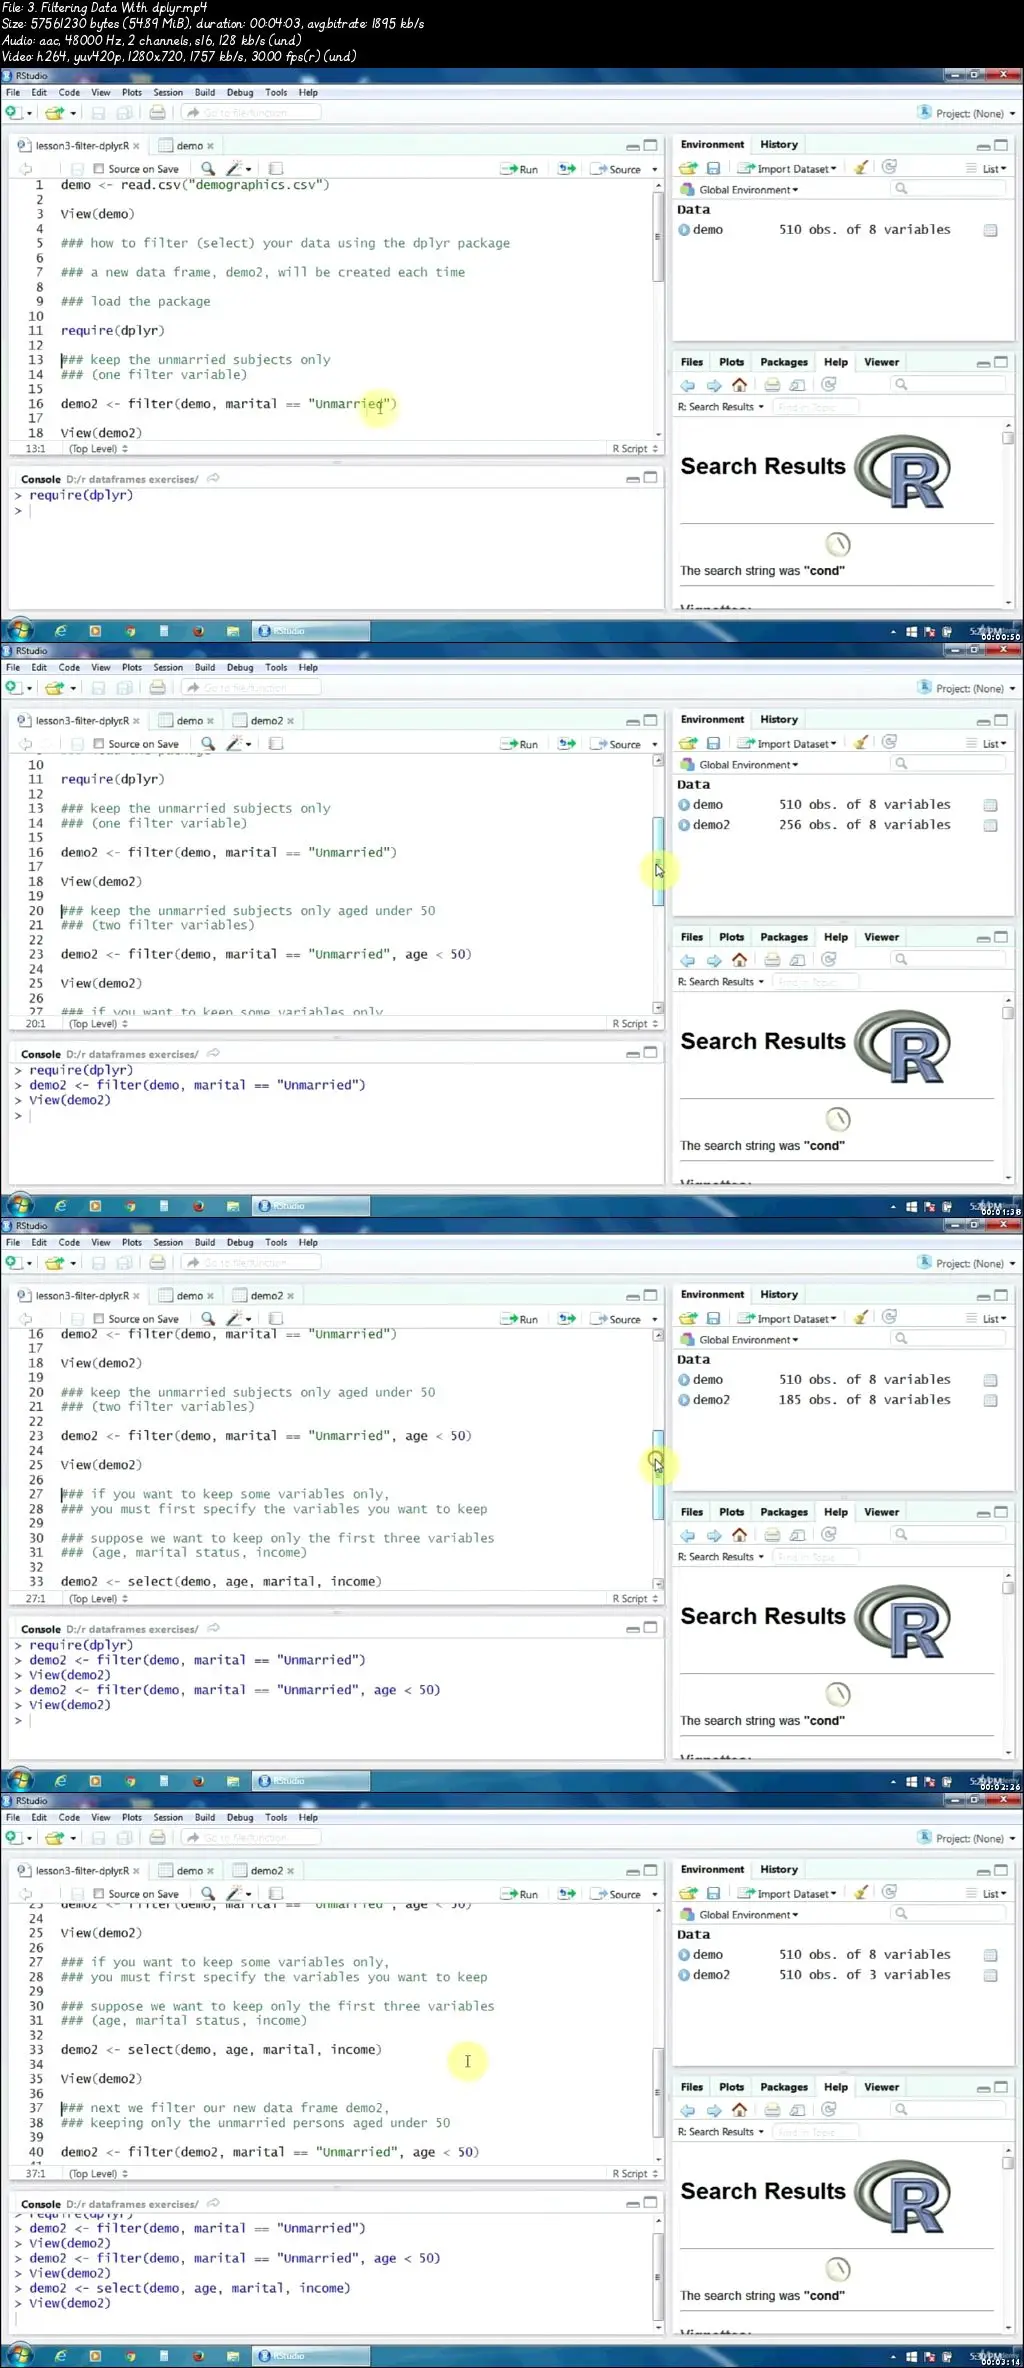
First of all, you will learn how to manipulate data in R, to prepare it for the analysis: how to filter your data frame, how to recode variables and compute new variables.
Afterwards, we will take care about computing the main statistical figures in R: mean, median, standard deviation, skewness, kurtosis etc., both in the whole population and in subgroups of the population.
Then you will learn how to visualize data using tables and charts. So we will build tables and cross-tables, as well as histograms, cumulative frequency charts, column and mean plot charts, scatterplot charts and boxplot charts.
Since assumption checking is a very important part of any statistical analysis, we could not elude this topic. So we’ll learn how to check for normality and for the presence of outliers.
Finally, we will perform some basic, one-sample statistical tests and interpret the results. I’m talking about the one-sample t test, the binomial test and the chi-square test for goodness-of-fit.
So after graduating this course, you will know how to perform the essential statistical procedures in the R program. So… enroll today!
Who this course is for:
students
PhD candidates
academic researchers
business researchers
University teachers
anyone looking for a job in the statistical analysis field
anyone who is passionate about quantitative analysis
Statistics with R - Beginner Level