Data Visualization Techniques

Data Visualization Techniques
MP4 | Video: AVC 1280x720 | Audio: AAC 44KHz 2ch | Duration: 2.5 Hours | 630 MB
Genre: eLearning | Language: English
MP4 | Video: AVC 1280x720 | Audio: AAC 44KHz 2ch | Duration: 2.5 Hours | 630 MB
Genre: eLearning | Language: English
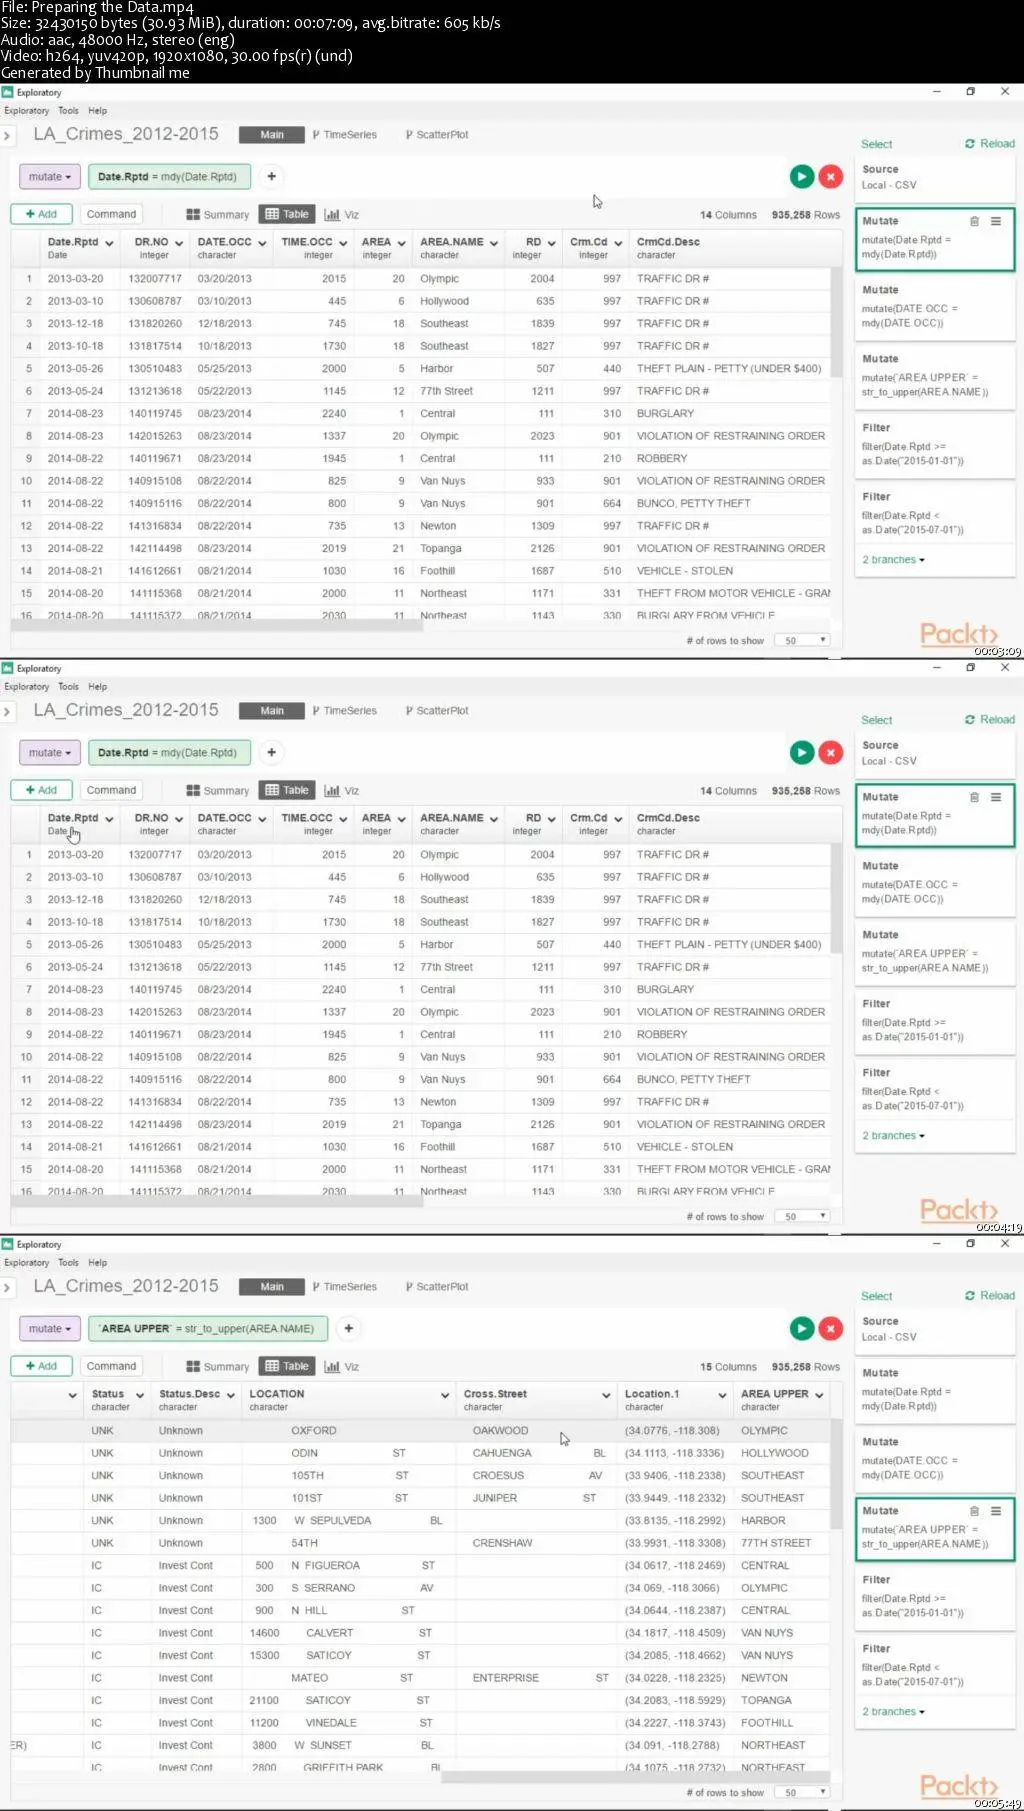
This course will focus on building a variety of data visualizations using multiple tools and techniques. This is where we will put the theory together with actual hands-on experience of creating effective visualizations. Our efforts will be spent on choosing the best display types for our dataset, and then applying best practice principles to our selected charts, maps, or network graphs. We’ll spend considerable time on some of the most useful chart types, followed by a section where we explore the multiple uses of maps as visualizations. Our final section focuses on understanding network graphs, a powerful tool for displaying relationship data.
Style and Approach
In this course you will learn data visualization best practices starting with understanding, preparing, validating, and matching your source data to the most appropriate display types. We will then work through examples of how to create compelling charts, including simple types such as line and bar charts, followed by more advanced charts including dot plots, box plots, and bullet graphs. Following this, you will learn how to create exceptional maps for geographic data, with a focus on dot density, choropleth, and categorical map types. Our final section will teach you how to visualize connected data sets using powerful network graphs.
Data Visualization Techniques