Excel Pivot Tables Crash Course
Excel Pivot Tables Crash Course
.MP4, AVC, 1280x720, 30 fps | English, AAC, 2 Ch | 1h 32m | 1008 MB
Created by Excel Mojo
.MP4, AVC, 1280x720, 30 fps | English, AAC, 2 Ch | 1h 32m | 1008 MB
Created by Excel Mojo
Excel Pivot Tables Crash Course: Master Grouping, Filtering, Calculations, and Visualizations
What you'll learn
- How to create and work with pivot tables to analyze and summarize data efficiently.
- Techniques for grouping, filtering, and organizing data within pivot tables.
- How to use calculated fields and columns for advanced data analysis
- How to visualize data with pivot charts and sparklines for clearer insights
- Mastery of dynamic filtering with slicers and timelines for interactive data exploration
Requirements
- A secure internet connection
- A device to access the course videos
- MS Excel installed on the device
- Basic knowledge of MS Excel
Description
Unlock the power of Excel pivot tables with this comprehensive crash course designed to transform your data analysis skills. Whether you're new to pivot tables or looking to sharpen your abilities, this course will guide you through every essential step.
Starting with an introduction to pivot tables, you'll learn their meaning, components, uses, and advantages, setting the foundation for more advanced techniques. The course then walks you through the process of creating and working with pivot tables in Excel, offering clear, step-by-step instructions.
Gain insights into grouping data, filtering using pivot tables, and the powerful capabilities of calculated fields and columns. You'll also discover how to filter data dynamically using timelines and slicers, improving your ability to analyze trends and patterns.
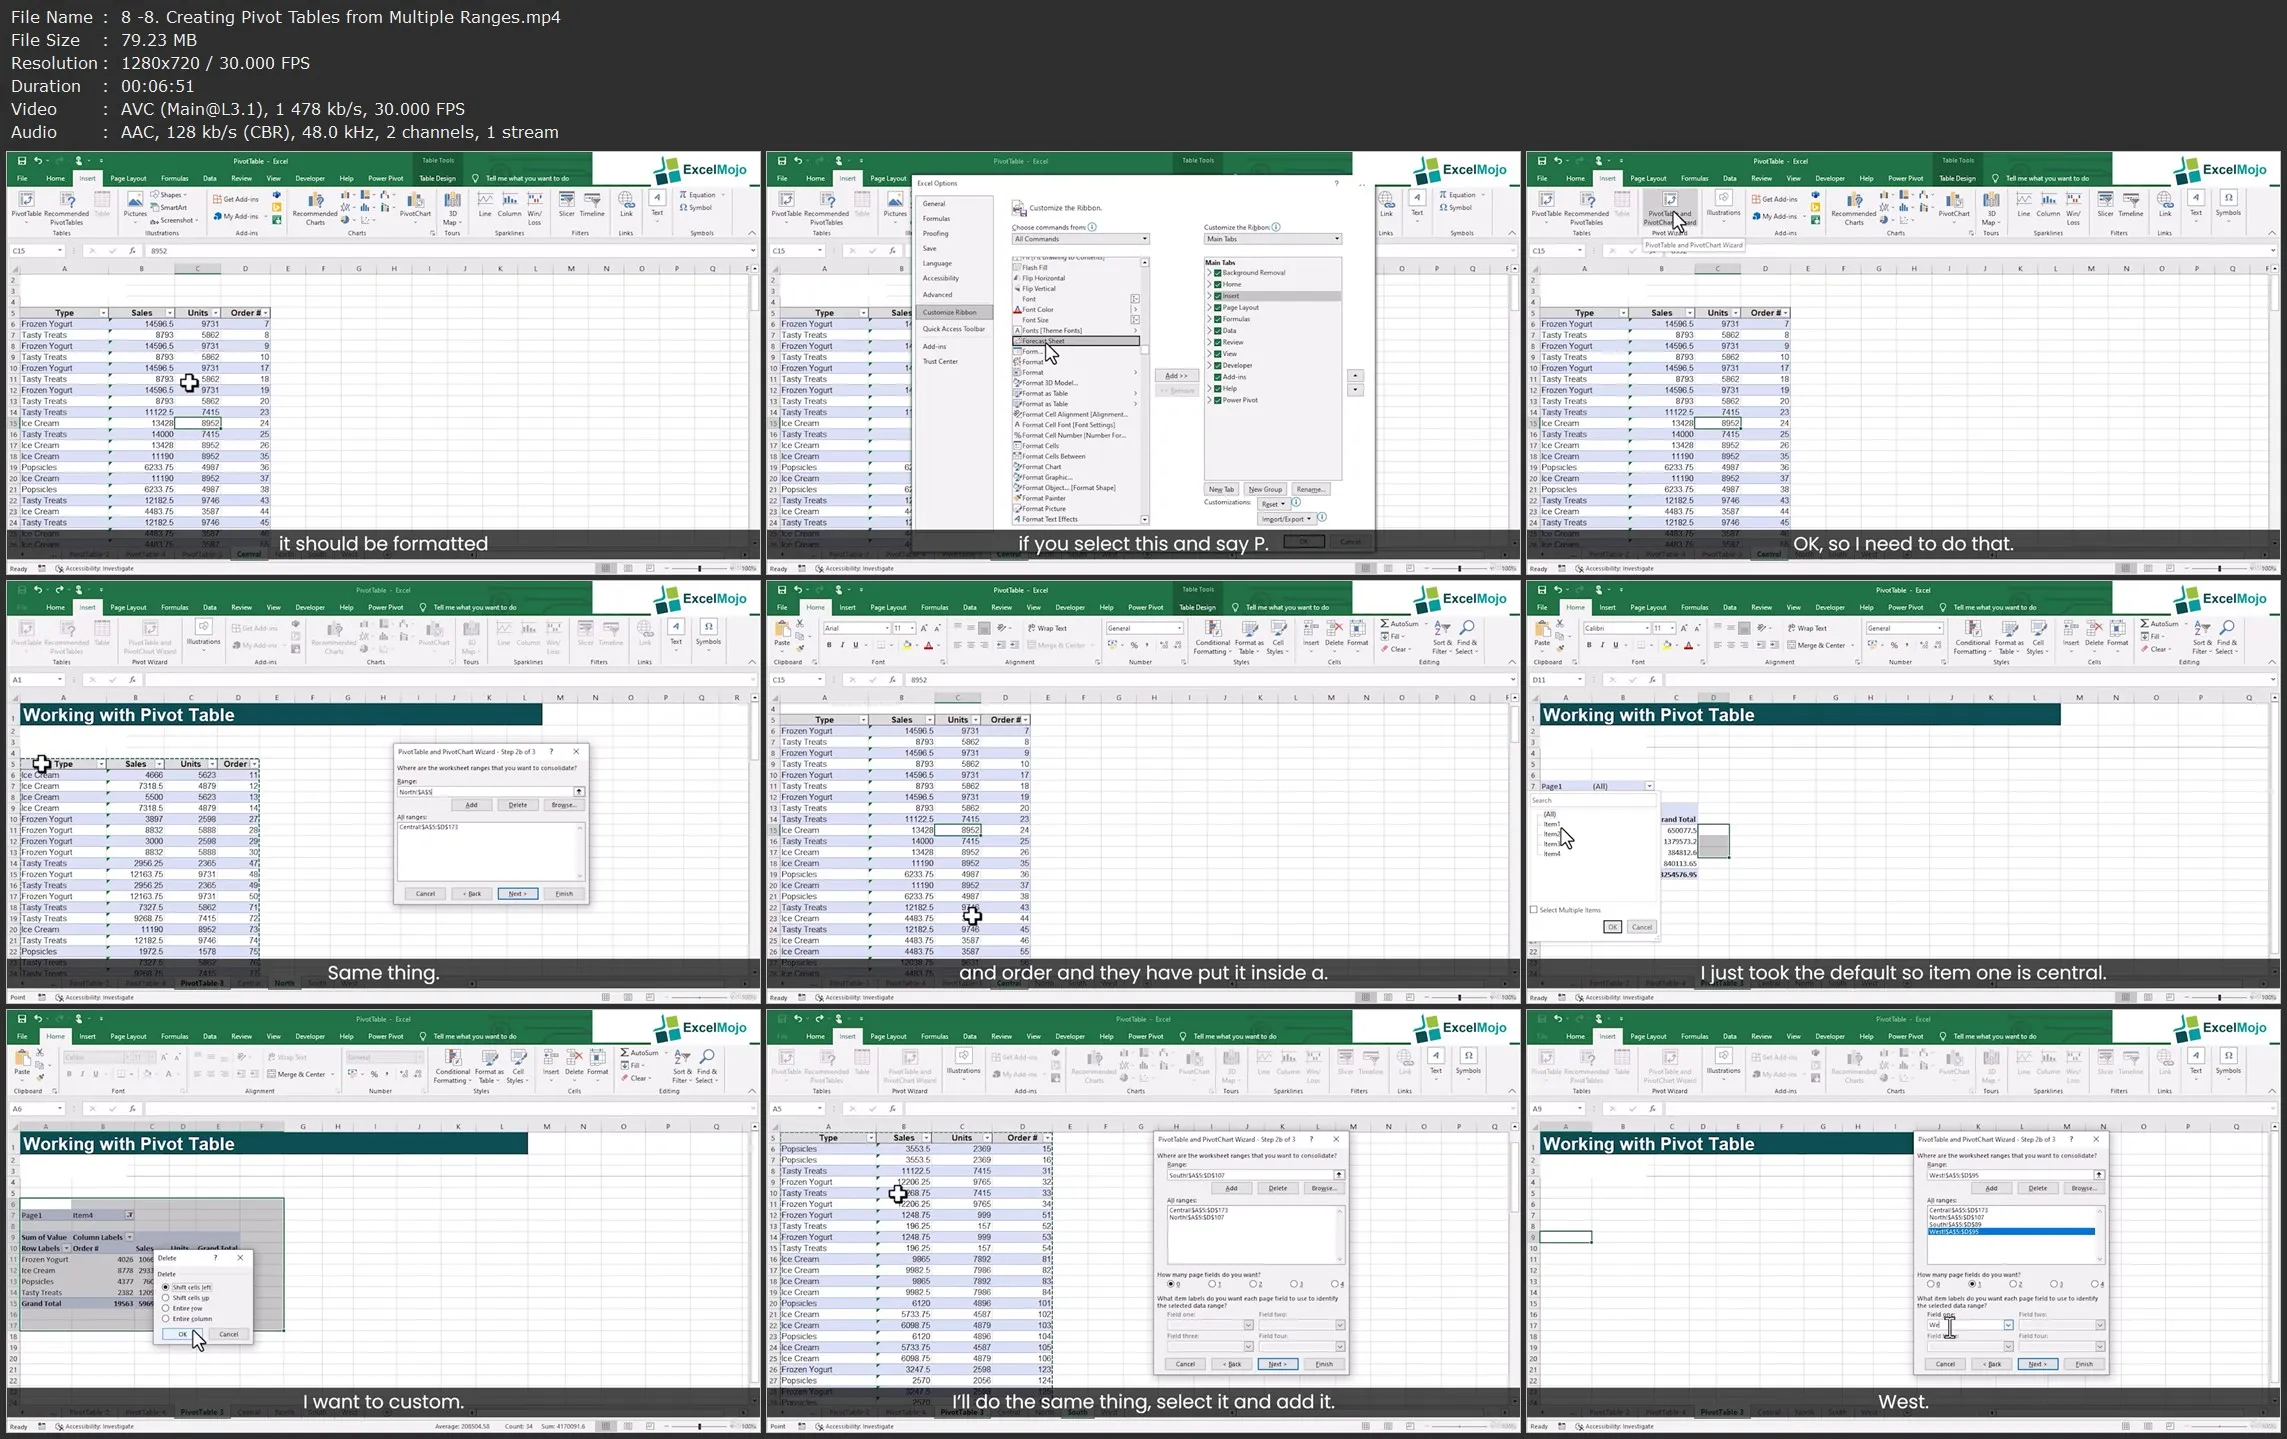
For users working with multiple data sources, the course covers how to create pivot tables from different ranges across various worksheets, ensuring that they are equipped to handle complex datasets. Through this course, you'll also master the use of the GETPIVOTDATA function, unlocking even more potential for analyzing and extracting insights from your data.
Visual learners will appreciate the lessons on creating pivot charts and using sparklines to present data more effectively. The course also explains the drill-down feature in pivot tables, allowing you to explore your data in greater detail.
By the end of this crash course, you'll have the skills to efficiently use pivot tables to summarize, analyze, and visualize data, transforming your Excel experience and boosting your productivity.
Who this course is for:
- Individuals looking to learn the basics of pivot tables and improve their Excel skills.
- Excel users who want to dive deeper into pivot table functionalities and enhance data analysis.
- Business professionals who need to efficiently summarize and analyze data for reporting and decision-making.
- Students or analysts seeking to master pivot table techniques for academic or career advancement.
Excel Pivot Tables Crash Course