Interactive Dashboards with Plotly and Dash
Interactive Dashboards with Plotly and Dash
.MP4, AVC, 1280x720, 30 fps | English, AAC, 2 Ch | 8h 30m | 1.14 GB
Instructor: Chris Bruehl
.MP4, AVC, 1280x720, 30 fps | English, AAC, 2 Ch | 8h 30m | 1.14 GB
Instructor: Chris Bruehl
This hands-on, project-based course is designed to help you learn Python's most popular packages for creating interactive dashboards and web applications: Plotly and Dash.
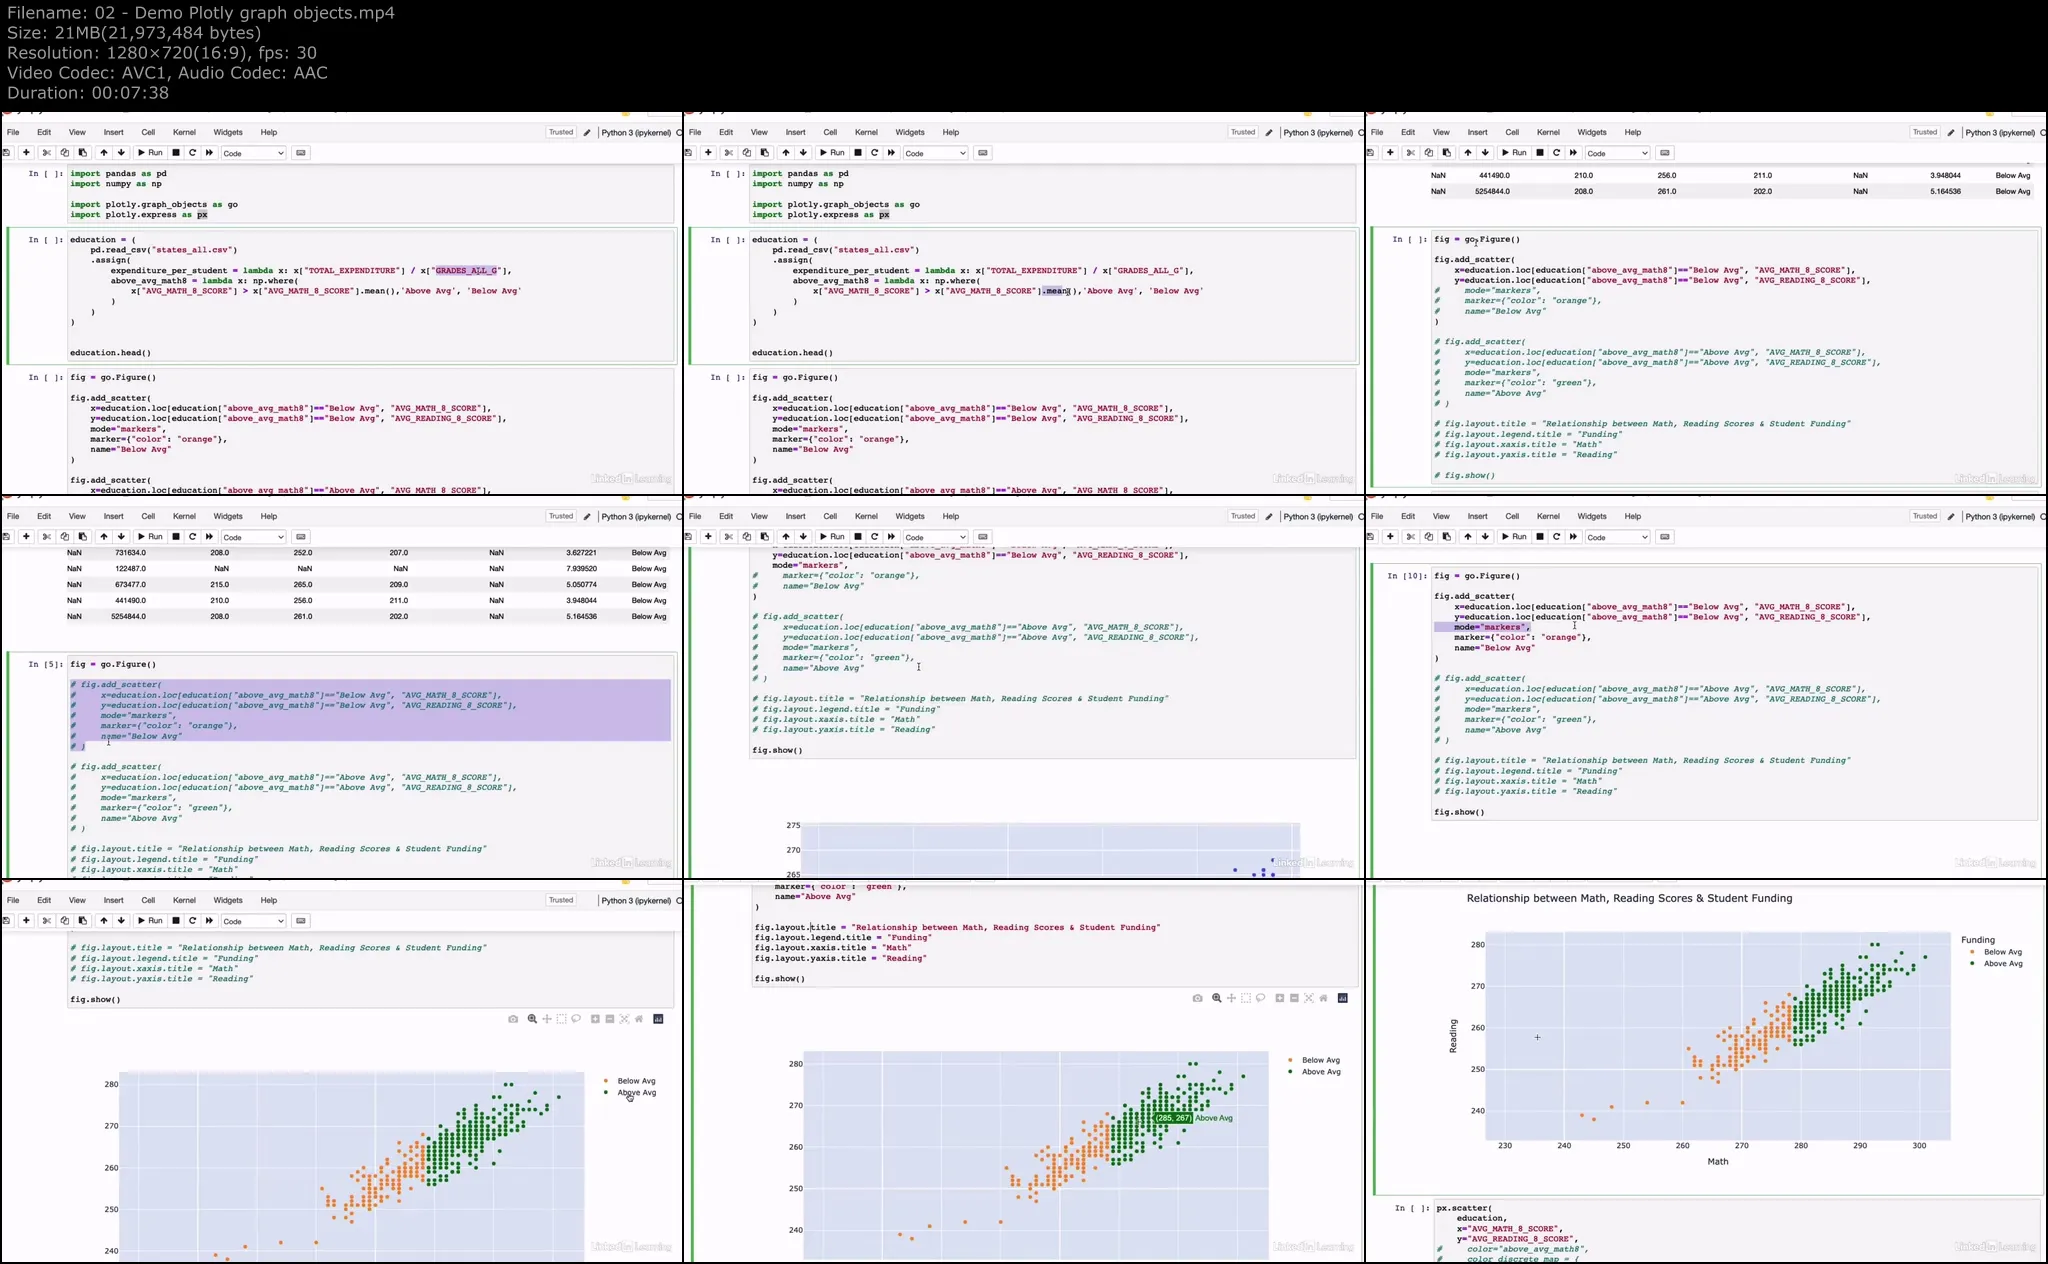
Instructor Chris Bruehl introduces the core components of a Dash application, reviews basic front-end and back-end elements, and demonstrates how to tie everything together to create a simple, interactive web app. He explores a variety of Plotly visuals, including line charts, scatterplots, histograms and maps.
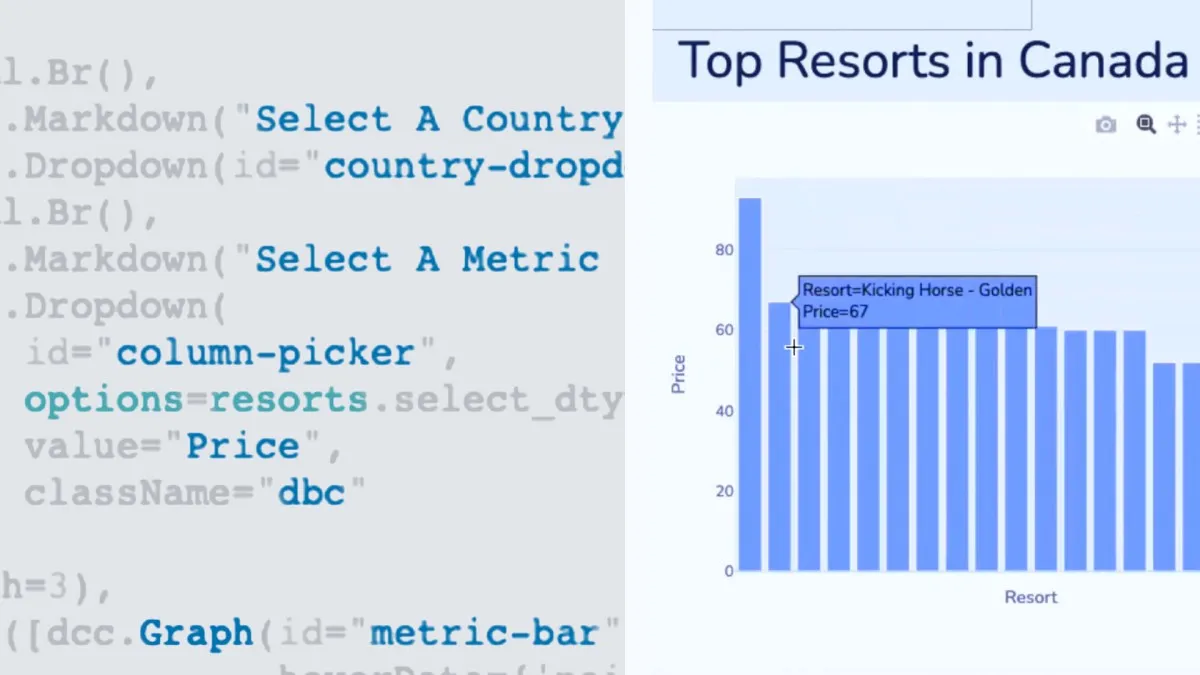
Learn how to apply basic formatting options like layouts and axis labels, add context to our visuals using annotations and reference lines, then bring your data to life with interactive elements like dropdown menus, checklists, sliders, and more. See how to use Dash to build and customize a web-based dashboard, using tools like markdown, HTML components and styles, themes, grids, tabs, and more. Chris also covers advanced topics like data tables, cross-filters, and app deployment options.
Learning objectives
- Identify the key components and steps for creating Dash applications.
- Learn about and interpret Plotly Express functions for creating basic charts.
- Discover methods for formatting Plotly Express charts.
- Identify and interpret the functions and use cases for the interactive elements in the Dash Core Components module.
- Learn about the syntax, structure, and components for callback functions in Dash.
- Identify and interpret the syntax for designing app layouts with HTML, markdown, and the Dash Bootstrap Components library.
Interactive Dashboards with Plotly and Dash