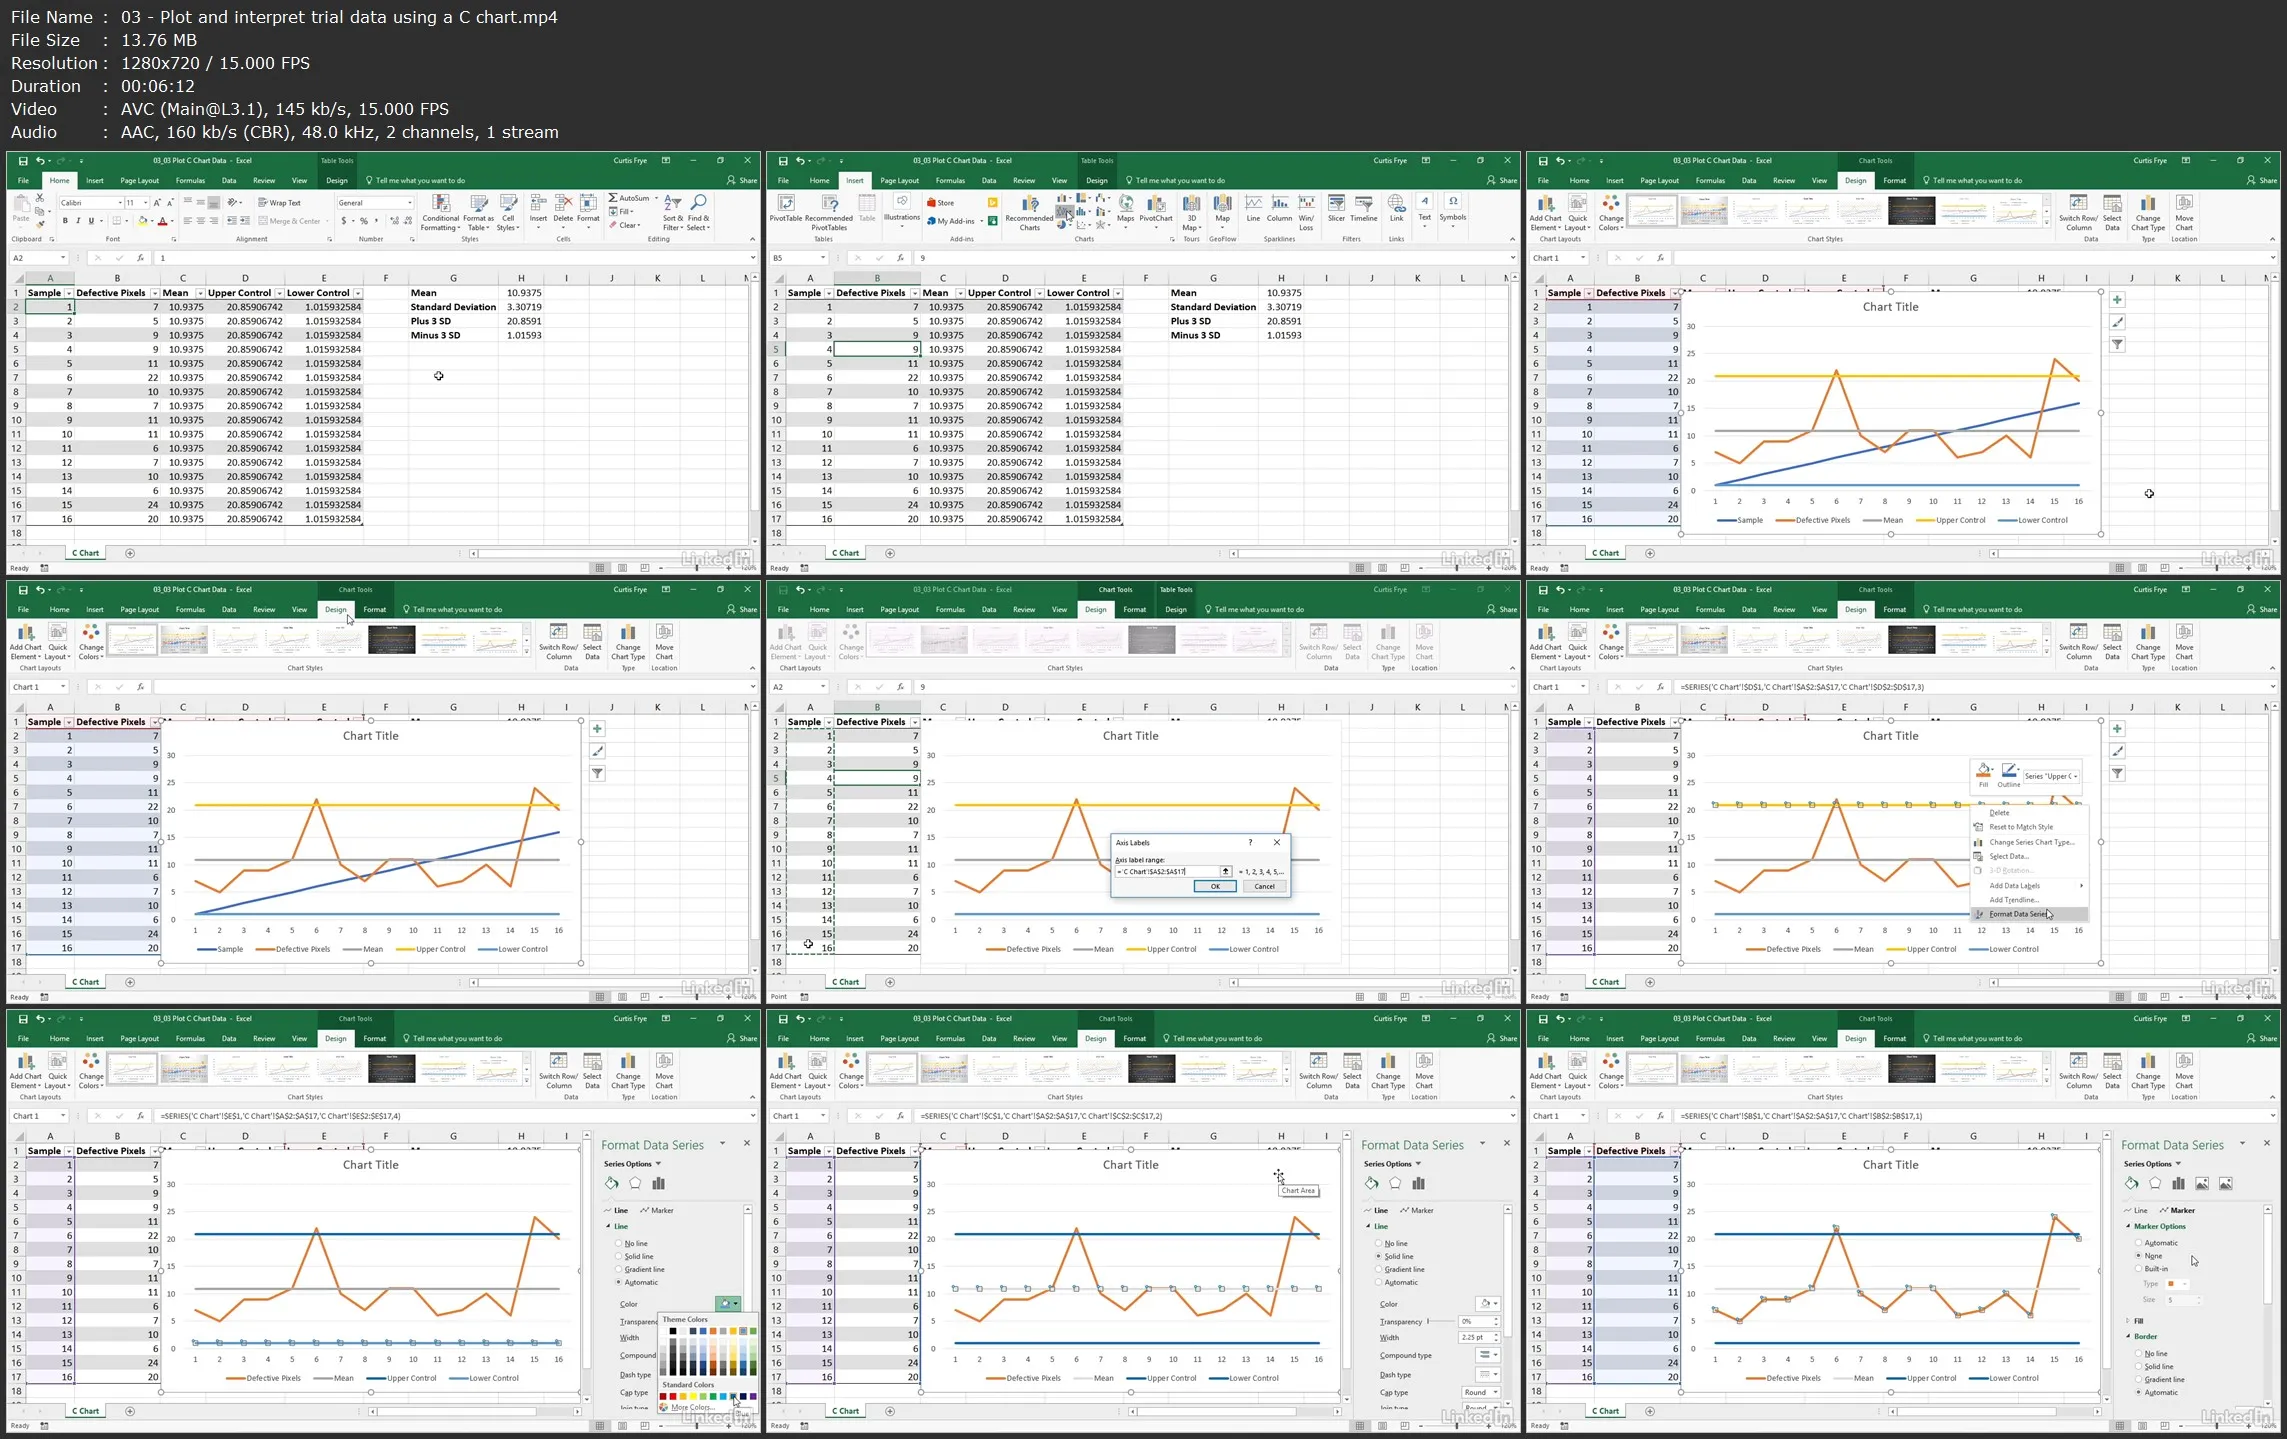
Excel: Statistical Process Control
Excel: Statistical Process Control
.MP4, AVC, 1280x720, 30 fps | English, AAC, 2 Ch | 1h 14m | 142 MB
Instructor: Curt Frye
.MP4, AVC, 1280x720, 30 fps | English, AAC, 2 Ch | 1h 14m | 142 MB
Instructor: Curt Frye
Learn how to analyze the accuracy and alignment of manufacturing processes using statistical tools. Veteran Excel trainer Curt Frye covers the three types of charts-P charts, C charts, and X-bar R charts-that are used to summarize the most common process metrics: proportion of defective output, number of defects, and variability of process outputs.
He shows how to perform the analysis, plot the data, and interpret the results of each technique. He also how to examine processes from the customer's perspective using process capability analysis. Business analysts and support staff who help prepare documents, as well as executives and senior managers who might not have a statistical background, will use the skills in this course to analyze their organizations' processes and output.
Learning objectives
- Describe what a P chart is used for.
- Identify how a C chart can be used to summarize count data.
- Define both X-bar and R charts.
- State the focus of statistical process control.
- Demonstrate how to calculate the standard deviation of data in a sample set.
- Point out what process capability analysis incorporates.
- Explain the process for calculating the process capability index.
- Identify the lowest point that the control limit line can go.
Excel: Statistical Process Control