

Advance S-Curve Using Power Bi | English
Advance S-Curve Using Power Bi | English
Last updated 10/2023
MP4 | Video: h264, 1920x1080 | Audio: AAC, 44.1 KHz
Language: English | Size: 1.38 GB | Duration: 2h 35m
Last updated 10/2023
MP4 | Video: h264, 1920x1080 | Audio: AAC, 44.1 KHz
Language: English | Size: 1.38 GB | Duration: 2h 35m
Advance S-Curve using Power BI
What you'll learn
Adjusted the weeks setup from P6 in Power Query
Getting the interval and cumulative plan value
Setup the financial period in P6 to store the update values every week
Setup the date table to get the PV and the EV in one curve
Getting the activity codes to Power BI
Link the codes with the curve to create dynamic chart interactive with the areas-zones etc.
Get the trend analysis
Get the variance, weight of variance, SPI, and the weight % for each activity
Requirements
Basics Power BI
Basics Primavera P6
Description
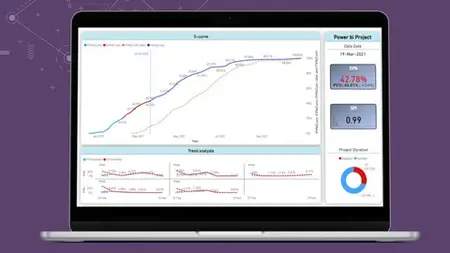
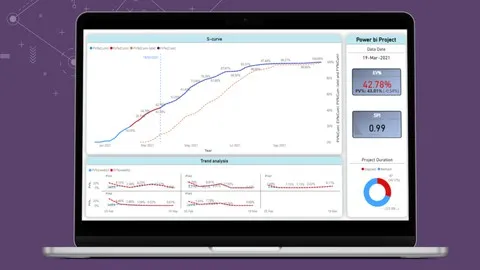
This course is designed to provide participants with the skills and knowledge required to create and analyze advanced S-curves using Power BI. The course covers more advanced topics such as cumulative S-curves, project forecasting, P6| Financial period, and advance Dax formula. Participants will learn how to use Power BI to create and analyze S-curves, and how to apply this knowledge to real-world scenarios in their own work.Creating interval and cumulative S-curves in Power BIUsing financial periods in P6 to store updated project values.Analyzing interval and cumulative EV %Setting up a date table to join PV and EV data into one curve.Developing custom measures and DAX formulas to calculate key project metrics.Importing activity codes to Power BILinking activity codes with the S-curve to create dynamic and interactive charts.Trend analysis using the S-curve.Variance, weight of variance, SPI, and weight % analysis for each activityReal-world examples of S-curve analysisBest practices for S-curve analysis in Power BIOngoing support and resources for participantsOverall, this course is designed to equip participants with the skills and knowledge needed to optimize project performance and resource utilization using advanced S-curve analysis and Power BI.This Course was built based on actual experience in presenting the progress for one of the Mega projects to the top management to allow and support the decision making.
Overview
Section 1: Introduction
Lecture 1 Introduction
Section 2: Baseline Data
Lecture 2 Baseline Export
Lecture 3 Adjust the week in Power Query.
Lecture 4 Getting the Interval PV%
Lecture 5 Getting the Cumulitve PV%
Section 3: Update
Lecture 6 Setup the Finanical period
Lecture 7 How to Store the updates
Lecture 8 Bring update to Power BI
Lecture 9 Getting Interval |Cumulative EV%
Lecture 10 Links the PV & EV in one Curve | Date Table
Lecture 11 Getting the Activity Codes in Power BI
Lecture 12 Links the Code with S-Curve
Lecture 13 Getting the Trend Analysis
Lecture 14 Getting the Variance | variance wt% | SPI
Section 4: Dashboard
Lecture 15 Create Dashboard
Planning Engineers,Project Control,Project managers