Grafana Beginners to Advance Crash Course || Free Lab Access

Grafana Beginners to Advance Crash Course || Free Lab Access
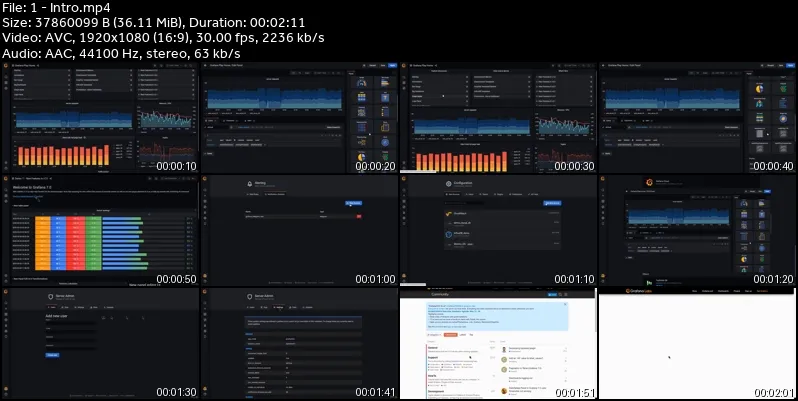
MP4 | Video: h264, 1920x1080 | Audio: AAC, 44.1 KHz
Language: English (UK) | Size: 3.50 GB | Duration: 7h 18m
MP4 | Video: h264, 1920x1080 | Audio: AAC, 44.1 KHz
Language: English (UK) | Size: 3.50 GB | Duration: 7h 18m
All you need to know to become a Grafana Pro Without Wasting a Minute
What you'll learn
Grafana Introduction
Grafana Overview and Overall Architecture
Installing Grafana on a Linux Server
Installing Grafana on Windows
Starting, Stopping Grafana Services on Windows
Installing Grafana on Docker
Creating Grafana Dashboards
Grafana User Interface Overview
Installing and Managing InfluxDB Services
Installing and Managing Telegraf Services
Grafana Dashboard - Server Health Summary Dashboard
Graph Panel - CPU & Memory Utilization
Graph Panel - Multiple Servers & Problem Statement to use Grafana Variables
Custom Variable - Static Variable Values
Query Variable - Dynamic Variable Values
Dependent Varialbes - Cascaded Variables
Automatic Repeat Panel Based on Variable Value
Organizing Panels and Dashboards for Easy Management
Repeat Row to Create Dynamic Grafana "Summary Dashboard"
Fixing Y Axis' Minimum and Maximum Value in Graph Panel
Creating Thresholds in Graph Visualizations
Python Program to Increase Memory Utilization for Testing Purpose
Creating Thresholds in Graph Visualization and StatsD Graphs
Advance Tabular Visualization With Gauge in one column
Advance Stat Visualization in Grafana 7
Exploring More Visualization Properties - Legends, Axis, Series Override
Creating Grafana Dashboard Using MySQL As Data Source
Using Custom SQL Query to Create Dashboard
Monitoring Websites and Docker Services
Monitoring Websites or URL Using Grafana
Monitor Docker Services
Installing Plugins
Installing Plugins and Creating Pie Chart Visualization
Creating Alerts and Annotation in Dashboards in Grafana
Grafana Email Alerts Configuration
Grafana and Telegram Integration and Alerts Configuration
Users and Roles Creation and Management in Grafana
User and Roles Creation in Grafana
Embedding Grafana Panel on Any Website
Embedding Grafana Panel in any HTML Page (Website)
Upgrading Grafana From Version 6 to Version 7 (Latest Version)
Upgrade Grafana From Version 6 to Version 7
Changing Grafana Database to MySQL
Requirements
Willingness to Learn New Technologies
Very basic understanding of Unix commands such as vi editor
Description
Dear Learners, Are you ready to transform the way you visualize and analyze data? In a world overflowing with information, mastering Grafana isn't just a skill – it's a game-changer. Imagine unlocking the power to turn complex data into stunning, actionable insights effortlessly. Welcome to Grafana course, where we're about to embark on a journey that will redefine the way you interact with data. Let's dive into the extraordinary world of Grafana together!We will discuss in detail on below topics:Basics:Grafana IntroductionGrafana Overview and Overall ArchitectureInstalling Grafana on a Linux ServerInstalling Grafana on WindowsStarting, Stopping Grafana Services on WindowsInstalling Grafana on DockerCreating Grafana DashboardsGrafana User Interface OverviewDatasources:Monitoring Servers with Prometheus and Node ExporterMonitoring Servers with InfluxDB Services and TelegrafMonitoring Microsoft AzureMonitoring AWS CloudMonitoring Docker ServicesMonitoring Databases Monitoring Website URLsGrafana Visualizations:Grafana Dashboard - Server Health Summary DashboardGraph Panel - CPU & Memory UtilizationGraph Panel - Multiple Servers & Problem Statement to use Grafana VariablesCustom Variable - Static Variable ValuesQuery Variable - Dynamic Variable ValuesDependent Varialbes - Cascaded VariablesAutomatic Repeat Panel Based on Variable ValueOrganizing Panels and Dashboards for Easy ManagementRepeat Row to Create Dynamic Grafana "Summary Dashboard"Fixing Y Axis' Minimum and Maximum Value in Graph PanelCreating Thresholds in Graph VisualizationsPython Program to Increase Memory Utilization for Testing PurposeCreating Thresholds in Graph Visualization and StatsD GraphsAdvance Tabular Visualization With Gauge in one columnAdvance Stat Visualization in Grafana 7Exploring More Visualization Properties - Legends, Axis, Series OverrideCreating Grafana Dashboard Using MySQL As Data SourceUsing Custom SQL Query to Create DashboardCustom Plugins InstallationInstalling Plugins and Creating Pie Chart VisualizationCreating Alerts and Annotation in Dashboards in GrafanaGrafana Email Alerts ConfigurationGrafana and Telegram Integration and Alerts ConfigurationUsers and Roles Creation and Management in GrafanaUser and Roles Creation in GrafanaEmbedding Grafana in External WebsiteEmbedding Grafana Panel in any HTML Page (Website)Upgrade & Changing Grafana DB to use MySQL Upgrading Grafana From Version 6 to Version 7 (Latest Version)Optional - Upgrade Grafana From Version 6 to Version 7Optional - Changing Grafana Database to MySQLAutomation and Grafana APIsUsing Grafana Canvas Panel and calling External APIsLearn to use Grafana APIsUser Creation using Grafana APIsAnnotations Creation using Grafana APIsCalling Automation tools for Auto HealingI am more than happy to create more detailed videos on certain topics based on the requests coming from students. If you need more clarity on any of the topics please write to me and I will be more than happy to create more detailed videos on certain topics based on the requests coming from students.
Who this course is for:
Data Scientists, Business Intelligence Analysts, Business Intelligence Developers

Grafana Beginners to Advance Crash Course || Free Lab Access