


Build Your First Data Visualization with Google Charts
Build Your First Data Visualization with Google Charts
Duration: 48m 59s | .MP4 1920x1080, 30 fps(r) | AAC, 48000 Hz, 2ch | 135 MB
Genre: eLearning | Language: English
Duration: 48m 59s | .MP4 1920x1080, 30 fps(r) | AAC, 48000 Hz, 2ch | 135 MB
Genre: eLearning | Language: English
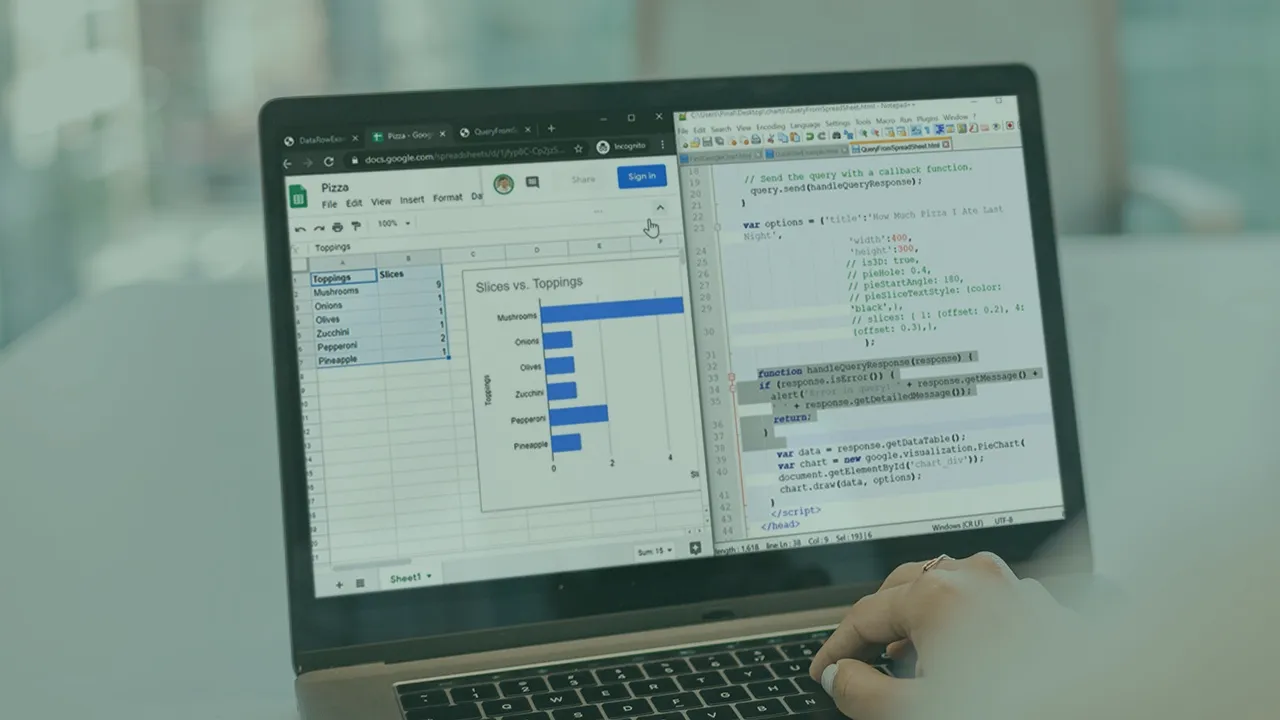
In this course, we will get started with our very first data visualization example with the help of Google Charts.
What you'll learn
Every single day we come across lots of data. The labels and numbers often confuse us when we see them in the spreadsheet. In this course, Build Your First Data Visualization with Google Charts, you will explore how data visualization gives us a complete story and also gives us a prediction of the future. First, you will gain skills to know the basic foundation of google charts. Next, you will learn how to build our very first visualizations with Google Charts. Finally, you will explore where to look for additional help once we have built our very first Google Chart. By the end of this course, you will be confident to get started with building your very first visualizations.
More Info